Query Profiler
The PROFILER tab will occur in the DATA/RESULTS pane after executing a SELECT query if the 'Query Profiler' feature is turned ON. If all options were selected in 'Preferences' the following information will display (provided that the server supports them all),
EXPLAIN Result: This will print the returns of EXPLAIN SELECT ... (for the SELECT query you executed). EXPLAIN is the most basic way to get information about how the query performs. It is supported by all MySQL versions. Most important you will see how indexes are used. Note that you can use FORCE INDEX in the query if EXPLAIN reveals another use of indexes than what you want.
EXPLAIN EXTENDED Information: For servers that support EXPLAIN EXTENDED that will be executed instead of "plain" EXPLAIN and also SHOW WARNINGS will be executed. The return of this SHOW WARNINGS is printed. Most important it tells exactly what the query looks like after it was rewritten by the Optimizer built-in the MySQL server. For instance a query with a subquery may have been rewritten to use a JOIN-construction instead. This option is supported by the MySQL server from 4.1 version.
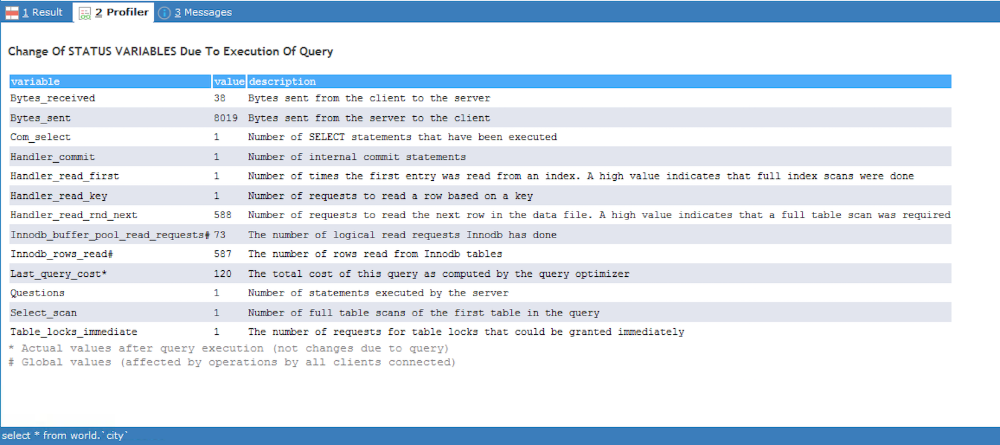
Change Of Status Variables Due To Execution Of Query: SQLyog retrieves the return of SHOW SESSION STATUS before and after executing the query and lists all those that changed due to execution of the query. Also the change for each is listed. This is valuable information and will also sometimes make it easier to interpret the output from EXPLAIN. Also some specific GLOBAL status variables will be retrieved that can give provide additional InnoDB-related information (but note that if more clients are connected you should know that they reflect what all connected clients are doing. So use with care!). Also with 4.1 and older servers SESSION option is not supported for SHOW STATUS, so on those older server versions all status variables displayed will be global). Finally a few listed status variables displayed are the actual values after execution of query (those are mostly related to query cache and for those the incremented value does not make sense). Global and point-in-time values are marked with a special symbol.
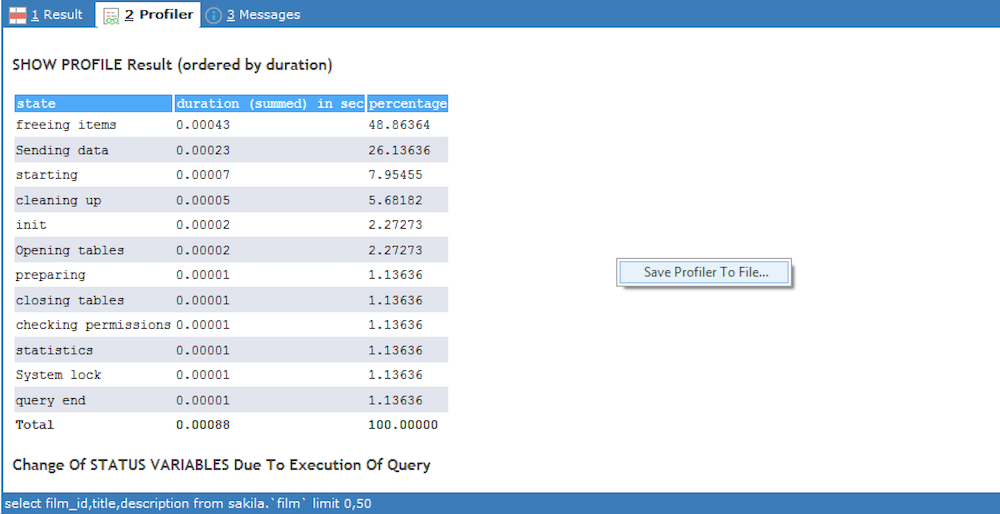
SHOW PROFILE Result: Server built-in 'Query Profiling' and the SHOW PROFILE command was added in MySQL 5.0.37. It is now available in all 5.x and 6.x server branches. It reveals detailed information of all internal operations that the server performed to execute the actual query and displays detailed time information for each operation (using microseconds accuracy). SQLyog will 'aggregate' (sum all values identified with same 'state' value) and sort the result of this calculation so that largest values will display at the top. SHOW PROFILE for a simple query will look like this in SQLyog:
You can save the output to a file in HTML format. Right click and select Save Profiler to File..
Note that in particular that the information displayed by SHOW PROFILE will depend on server configuration (including Query Cache configuration) and the size of databases and tables on the server. You should not expect identical (or even similar) results for SHOW PROFILE on different servers (this is actually to some extend true for all the four types of information displayed as the MySQL optimizer may sometimes select different execution plans depending on configuration and on data, but SHOW PROFILE is mostly afffected!). Note that you can add SQL_NO_CACHE option to the query if you want profiling information not 'disturbed' by Query Cache operation.
Also note the current restrictions of this Query profiler feature:
Query profiler is only enabled when executing a single query - not when 'execute all' executes more than one query.
SHOW PROFILE is enabled only if the server supports the server variable 'profiling'. The very first versions of the server that shipped with profiling (like 5.0.37) did not have this server variable implemented.
Note:This feature is available in SQLyog Ultimate.


